20 Years… and Counting
Over the past two decades, Quanta has become the leader in the specialty infrastructure services industry through innovative thinking and safe execution, which has woven our company into the very fabric of the utility space. We continue to hold this position by building the industry’s strongest and safest teams, anticipating and capitalizing on macro industry catalysts, and maintaining focus on a multi-year plan. Throughout our history, Quanta’s executive leadership has implemented this approach, which has allowed us to grow profitably and dramatically since Quanta’s inception.


Today the people of Quanta stand together as a workforce of more than 39,000. The vast majority of these employees are our industry-leading craft labor force, who bring the skills required to safely deliver execution excellence.
In 2018, the markets that Quanta serves were healthy and growing. We capitalized on opportunities by continuing to foster our entrepreneurial business model and collaborating closely with customers to develop infrastructure solutions that meet their needs and help them better meet the needs of their customers. Our goal is to continually evolve to make them better. We solidified our regional structure, which allows us to better serve the evolving needs of our customers as their service lines and geographies expand. This has allowed us to move forward as one, but with the agility to adapt to market conditions and seize opportunities.
20 Solid Years
Quanta has operated through multiple market cycles over the past 20 years. Regardless of economic conditions, we have remained steadfast to our long-term vision and strategies, which has driven stable overall growth throughout our history. We are pleased to report that 2018 was the best year so far.


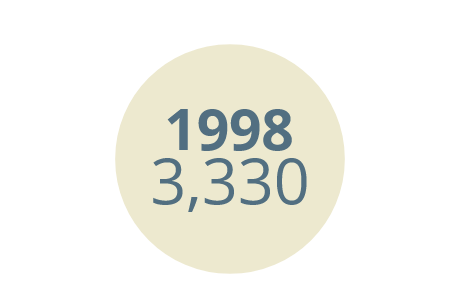


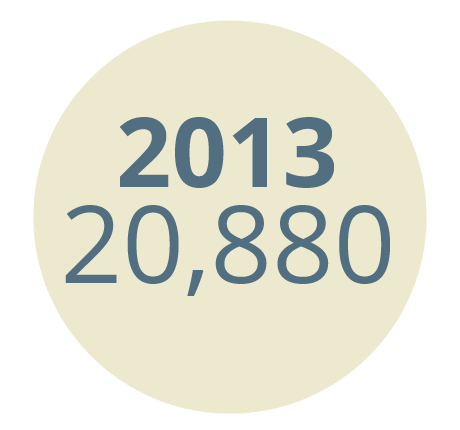
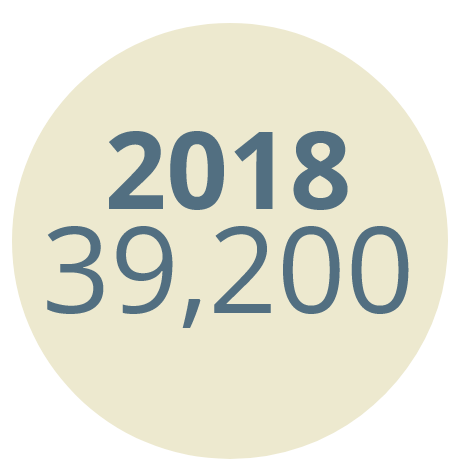

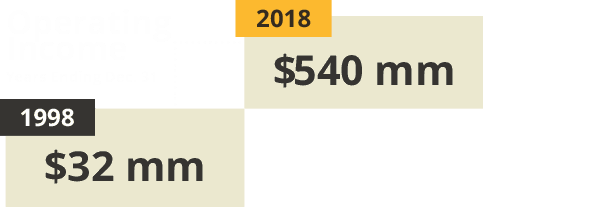
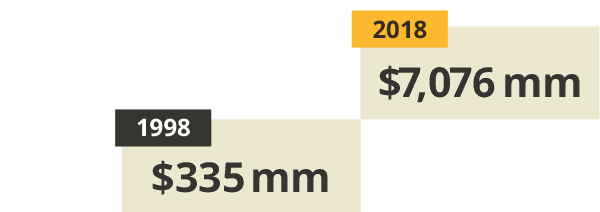
(1) A reconciliation of backlog (a non-GAAP measure) to remaining performance obligations
(the most directly comparable GAAP measure) is set forth herein.
(2) Twelve-month backlog is reflected from 2001 through 2006. Remaining periods reflect total backlog.
Quanta’s 20-year history is built upon a heritage that goes back much further. Many of our operating companies have served our markets for more than 50 years.


Strong Results in 2018
Quanta achieved strong results in 2018. Our business was robust, as demonstrated by a number of financial and operational records. We expect our success to continue as we execute our strategy to build Quanta’s base business across all service lines, supplemented by select larger project opportunities.


(1) A reconciliation of Adjusted EBITDA (a non-GAAP measure) to net income from continuing operations attributable to common stock (the most directly comparable GAAP measure) is set forth herein.
(2) A reconciliation of GAAP and Adjusted Diluted Earnings Per Share (a non-GAAP measure) is set forth herein.

